


With the S&P up 7% year to date, is it time to sell in May and go away?
It’s an old Wall Street adage, and the data appear to bear it out. Since 1950, the S&P has returned 3.4% on average for the year up to April, while returns from June to October have averaged only 0.9% over that time.
However, over the last five years, the dynamics of the monthly seasonal trade have not only changed but have become even more pronounced.
Summertime Has Been Producing Good Returns:
Beginning in 2012, January to April returns have averaged 4.9%, similar to the full series from 1950, but June to October returns have also averaged a healthy 3.95%.
Most notably, July has emerged as a very strong month, and June has turned from negative to positive. Also of note, the seasonal weakness in September has pulled forward into August.
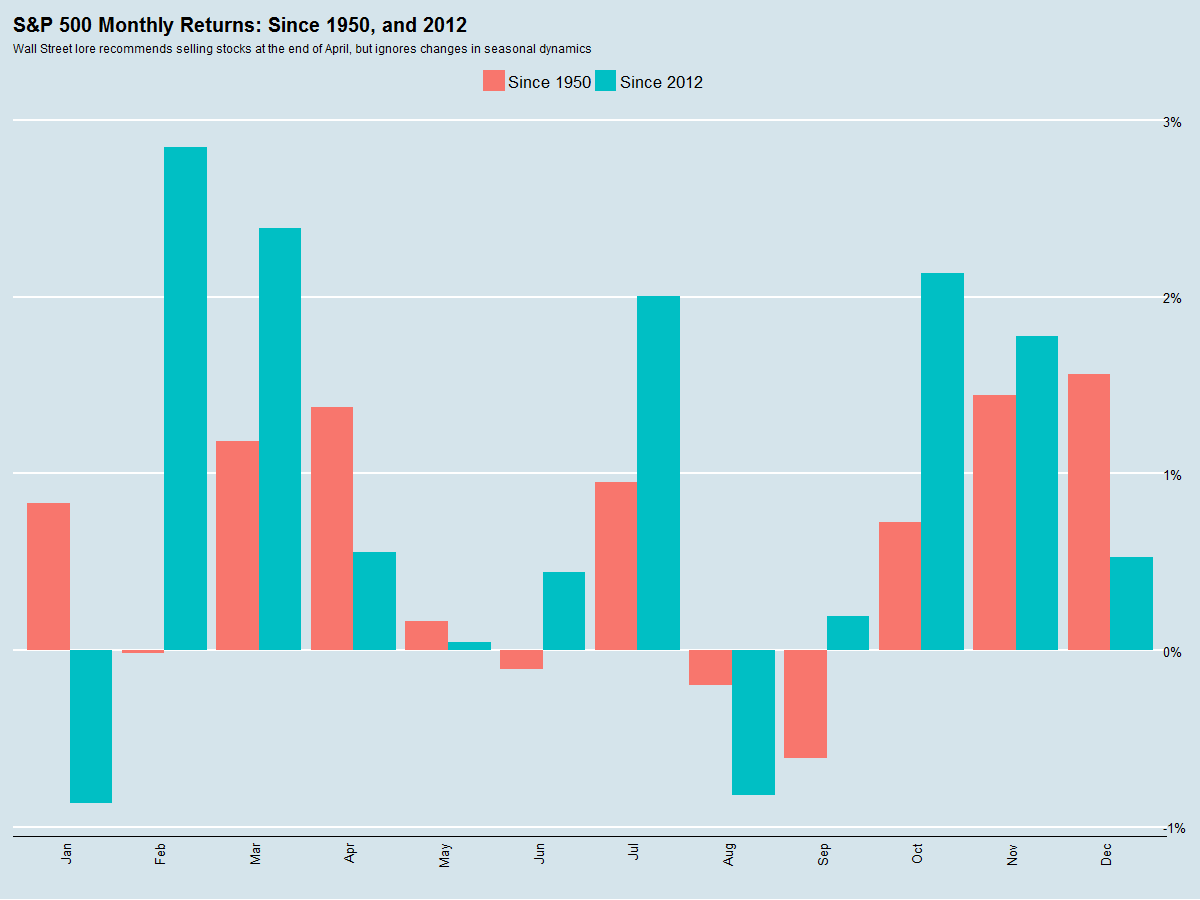
This analysis suggests that August, not May, is the real bogeyman for investors.
Volatility Has Been Spiking In August:
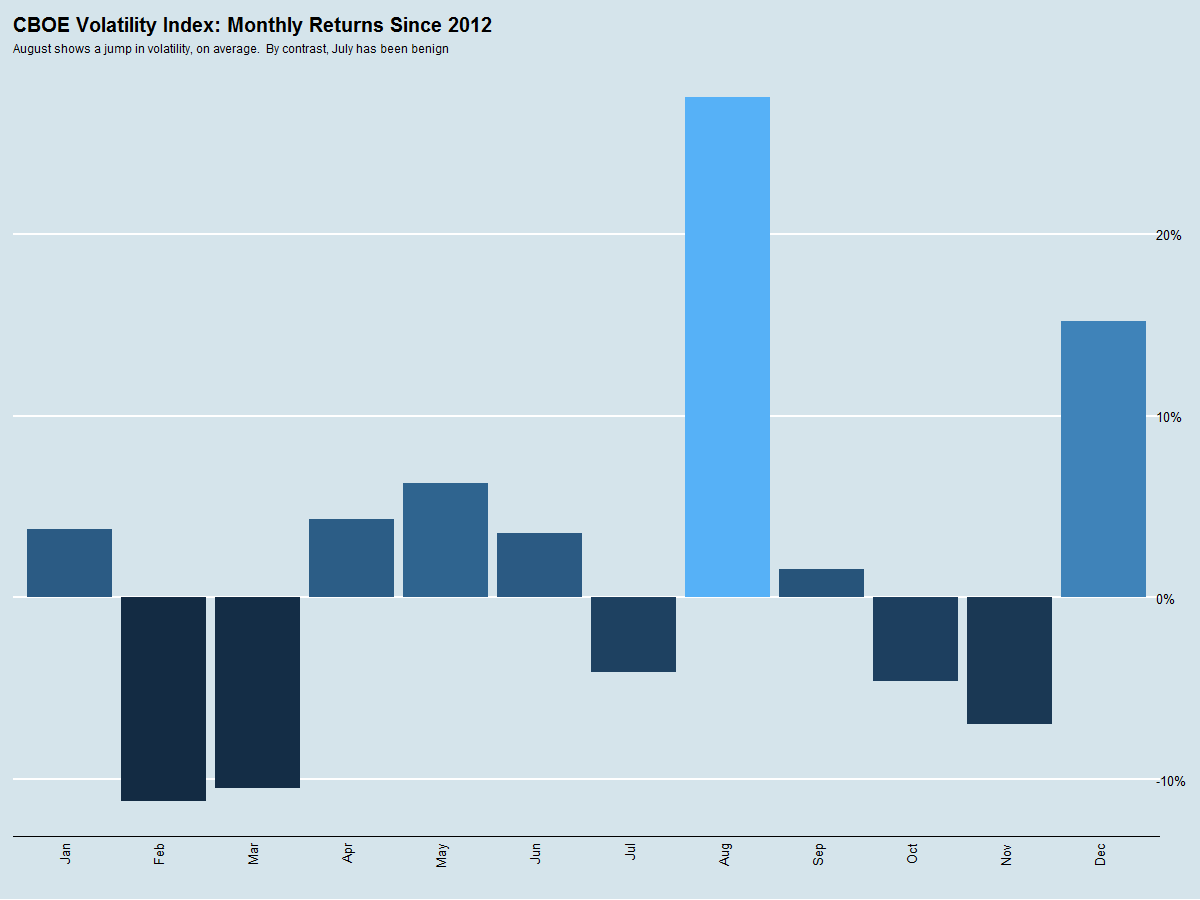
Another way to come to the same conclusion is to look at the average returns of the CBOE VIX index shown below.
The VIX index is a measure of stock market volatility, and rapid changes in market volatility are highly correlated with negative stock returns. Over the past five years, August has been a very volatile month. By contrast, July has lower average volatility, much like February, March, and November.
The conclusion – Sell in May has (recently) gone away.
Which then leads us to ask: How to monetize this idea?
Sectors Which Do Well In the Summer:
First, we looked at sectors which have, since 2012, typically done well over the June-July time frame ahead of August’s turmoil.
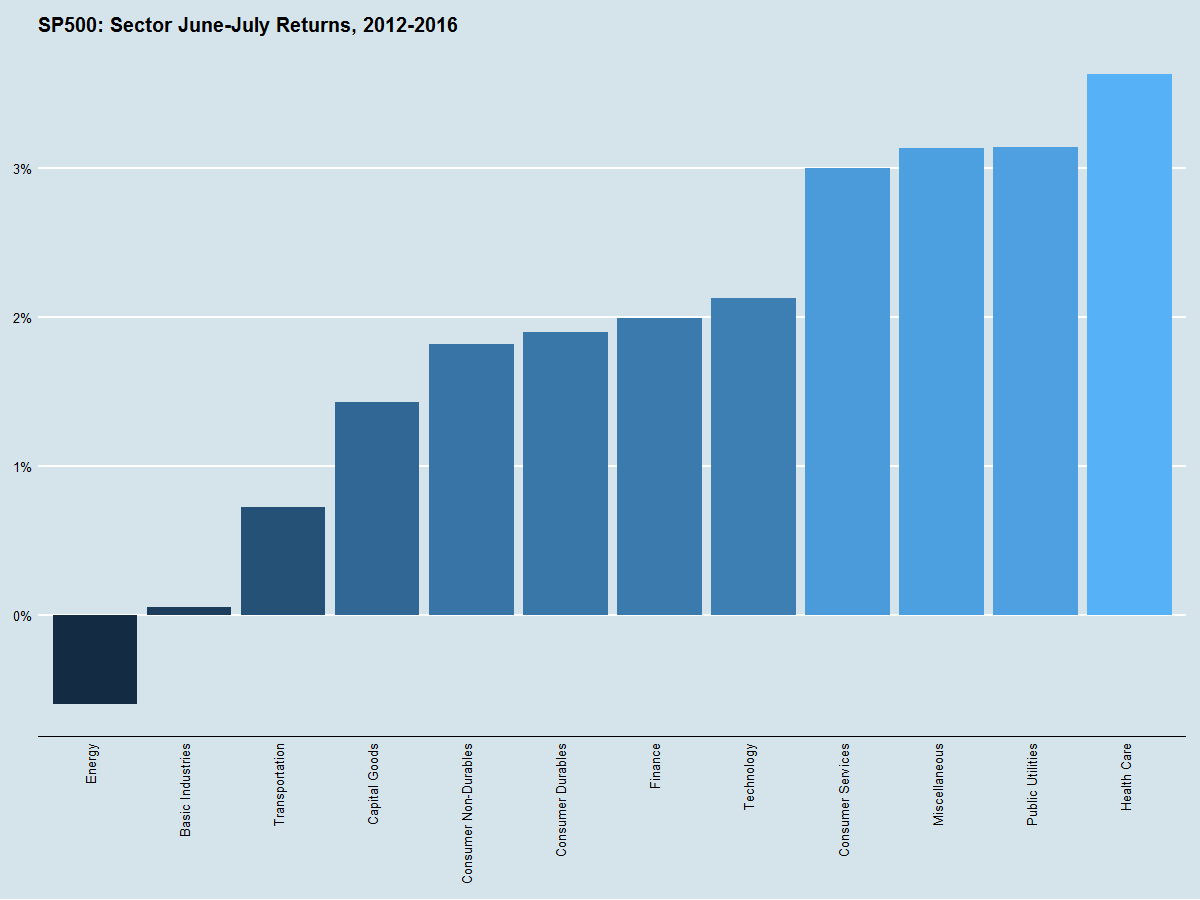
Energy, Basic Industries, and Transportation have tended to under perform. Health Care, Utilities and Consumer stocks have tended to do well and that’s where we should look for buys.
Seasonal Buy Rank Table:
Taking this analysis one step further, we can rank stocks which are not up a lot year to date and yet which usually do well in the summer months before August.
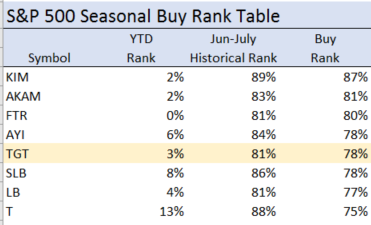
Target (TGT) screens well. Relative to the S&P 500 it is only in the 3rd percentile for year to date returns, yet it is in the 81% percentile for June-July going back to 2012. It’s also a consumer stock, which is a good summertime sector as we have shown above.
Further proof of the historical returns for June and July for this stock can best be seen by using the Returns menu in Sentieo, shown below.
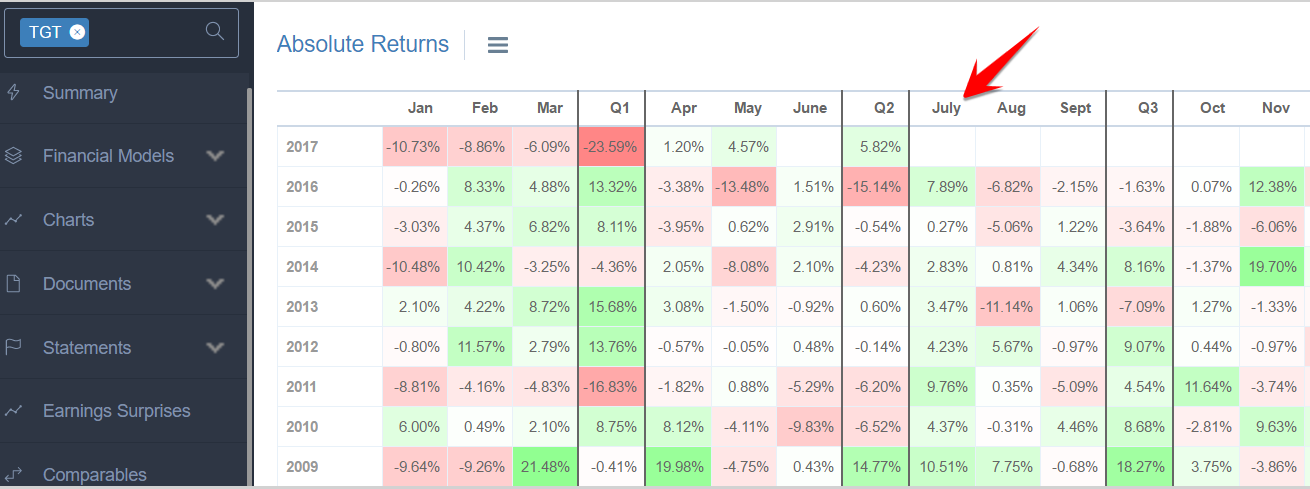
TGT is a solid green in the month of July going back to 2009.
Where might monthly seasonality come from?
Historically the stock market was much more driven by seasonal cycles in manufacturing and crop harvesting. In the modern era, it may be the case that investors’ expectations are more and more the source of returns.
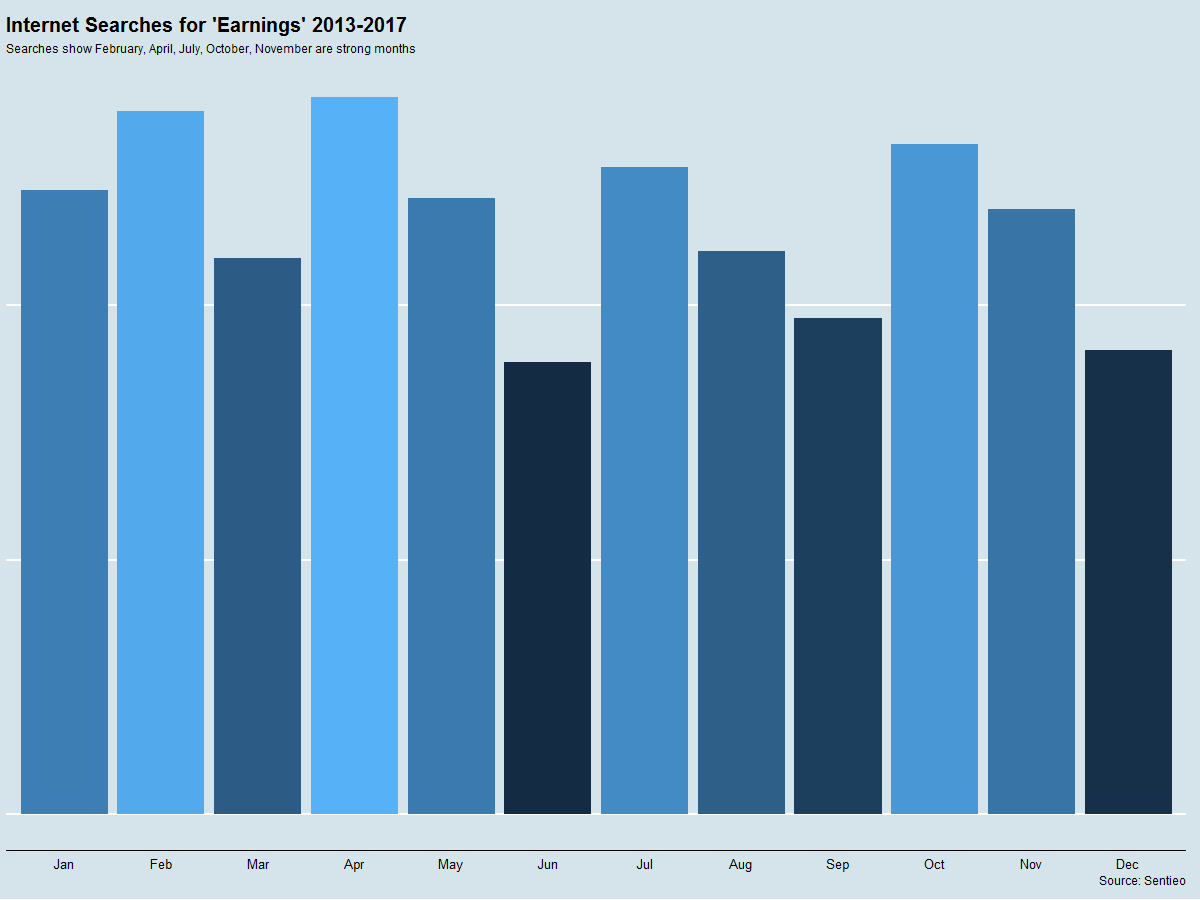
Again using the Sentieo platform, we can see internet searches for the word “Earnings” and use that as a proxy for which months we are likely to see the most earnings reports.
As shown below, the big search months appear to be January-February, April, July, and October. So one theory explaining the shift in the dynamics of monthly seasonality the past five years versus a look back to 1950 might be that modern managements are far more savvy about setting lower expectations earlier in the year (hence weak January results) and are able to “jump over” the low bar later in the year – thereby driving the now-more-positive returns in July and October relative to history.
Conclusion:
Sell in May? No way!
Summing it all up, before you follow a well-worn adage, take a minute and check against the monthly returns map in the Returns menu on the Sentieo platform. You may capture returns others don’t.
And don’t forget: this year, it may pay to wait to sell until July!
