Zynga’s 3D Clash of Clans killer Dawn of Titans finally dropped worldwide after years spent in beta (Press Release here). To say that this was highly anticipated is an understatement:
- VentureBeat: “Zynga finally releases its epic action strategy mobile game Dawn of Titans“
- Gamezebo: “Dawn of Titans Has (Finally) Arrived, and We Played it Early“
- PocketGamer: “Dawn of Titans launches worldwide after almost two years in soft launch“
And reflected in Wall Street expectations (direct link for Sentieo subscribers only):
- Wedbush (bull): “Our bookings estimate calls for q-o-q growth of $24 million, $15 million higher than consensus; we think that Dawn of Titans may add $25 million or more of bookings (in 1Q17)”
- Cowen (bull): “We view the launch and performance of Dawn as a key catalyst for shares.”
- Credit Suisse (bear): “It remains to be seen whether Dawn of Titans will add to the win streak.”
Because the app has already been in the wild for years AND is a material part of the investment case for ZNGA, this is a textbook example to analyze with Sentieo’s Mosaic tool and our newest data partner, Apptopia. Apptopia provides the most accurate app store downloads, revenue, and SDK data for every mobile app & every publisher in the world, and we are excited to partner with them to show how the best-informed investors are using their data to drive investment decisions. Our goal with Part 1 of this post is to provide “Three Things You Should Know” leading into the Dawn of Titans global launch.
1. We Have Been Here Before
Longtime Zynga investors will do well to be cautious of pinning everything on one large game launch. Empires and Allies (E&A) was the closest parallel to Dawn of Titans (DoT) that Zynga has had before, and that died an agonizing death in 2013 as one of Zynga’s multiple Facebook-centric desktop-gaming-related casualties. Zynga was ultimately never able to transition E&A successfully in the rapid consumer shift to mobile. However, wouldn’t it help to level set expectations for DoT if we knew what E&A’s numbers were historically? Apptopia to the rescue:
| Period | In App Purchases | Advertising | Total Revenues | Downloads | Users |
| First Week | $44,535 | $4,534 | $49,069 | 241,746 | First six days averaged 100,715 daily active users and the last day of opening week saw 1,982,335 users. |
| First Month | $1,334,471 | $34,005 | $1,368,476 | 3,953,881 | An average of 179,060 daily active users. |
| First 3 Months | $3,540,354 | $136,165 | $3,676,519 | 9,518,533 | An average of 10,505,733 monthly active users |
Note: all Apptopia numbers in this post are estimates and should be adjusted for final reported numbers.
2. Beta Test was Successful Worldwide and Engagement ranged from 23% to as high as 37%
It seems that Zynga’s bet on groundbreaking graphics (in its $572m purchase of NaturalMotion) is paying off. We have two metrics to highlight here. First it is notable that the beta test countries seeing the strongest downloads were very widely distributed across Europe and Asia, in Anglophone as well as non-Anglophone countries.
Netherlands, Singapore, and New Zealand were the top three iOS locations with downloads in the hundreds of thousands, while for Android, Malaysia, Chile, and Austria topped the charts:
DoT iOS Downloads
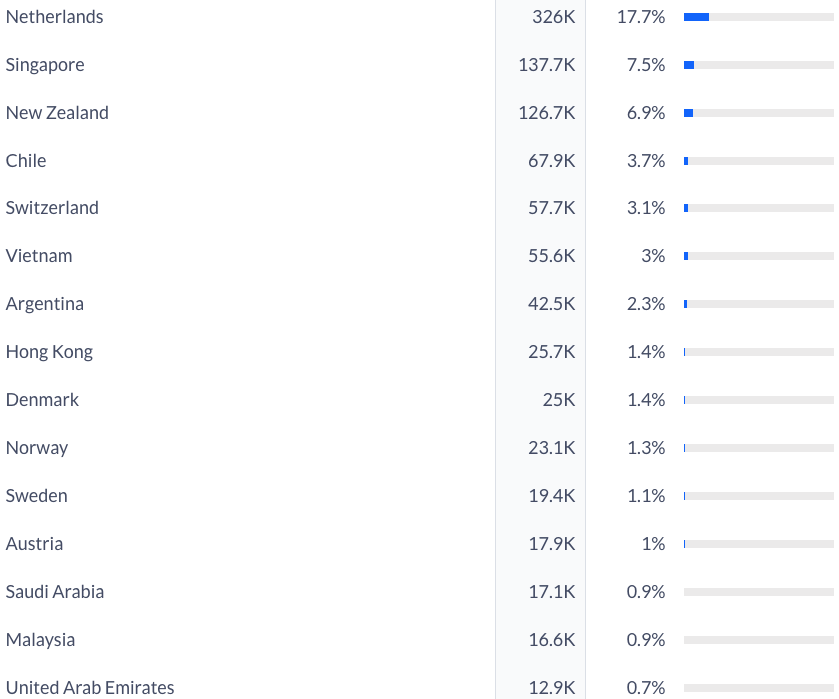
source: Apptopia
DoT Android Downloads
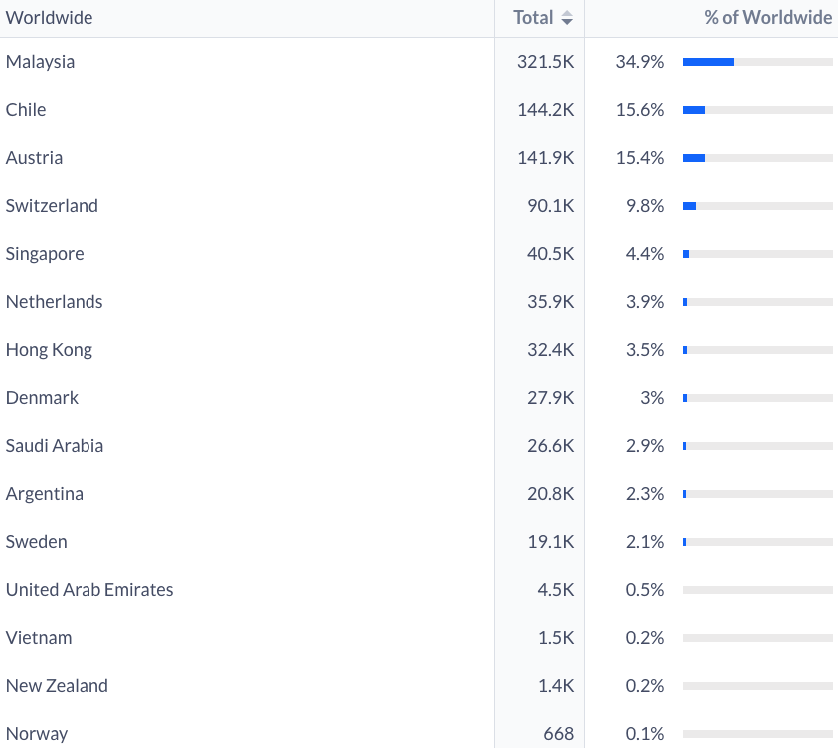
source: Apptopia
It is notable that the response in the Middle East has been weaker but these numbers are not adjusted for population or marketing span. Still it is impressive that the game has been optimized for global relevance for worldwide launch, indicating Zynga’s understanding of the need for significant global launch momentum for the long term longevity of the game.
Downloads are only the first battle; the true test of a game’s mettle is how many stick around (to be ultimately monetized). Here, we see extremely encouraging numbers too, with DAU/MAU ratios ranging from 23-37% worldwide even 2 years after soft launch:
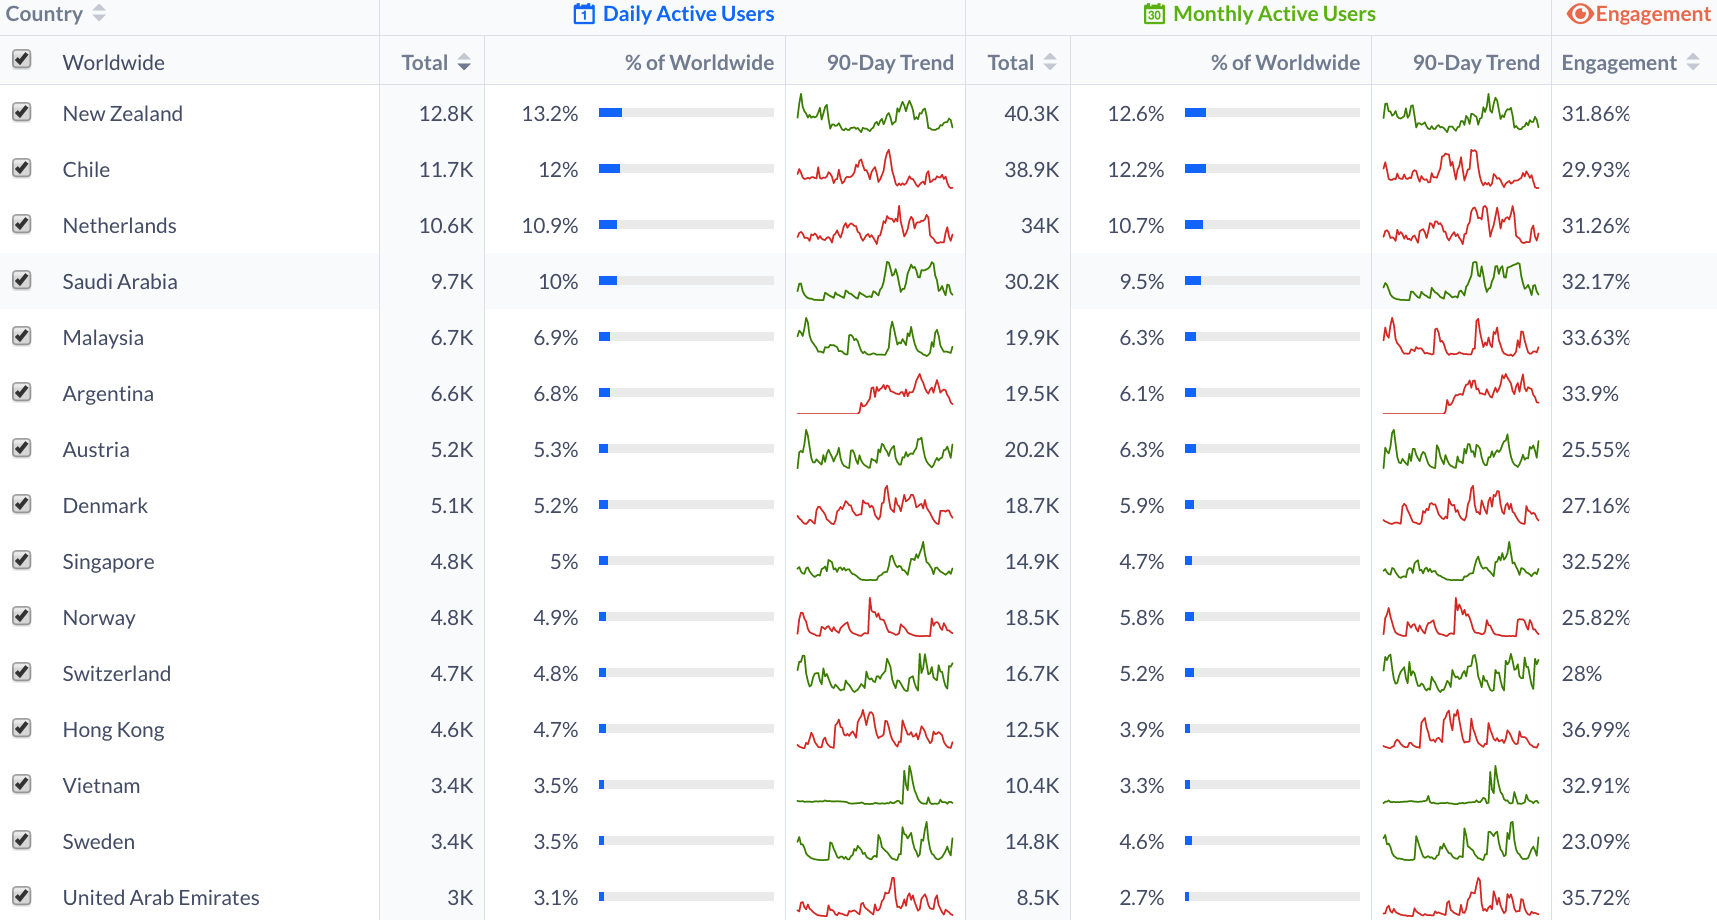
source: Apptopia
Compare this to Zynga’s firmwide DAU/MAU ratio of 27%: only 2 out of the 15 beta test countries had lower DAU/MAU ratios. This means that Dawn of Titans has an extremely high likelihood of materially lifting Zynga’s overall DAU/MAU ratio given sufficient reach.
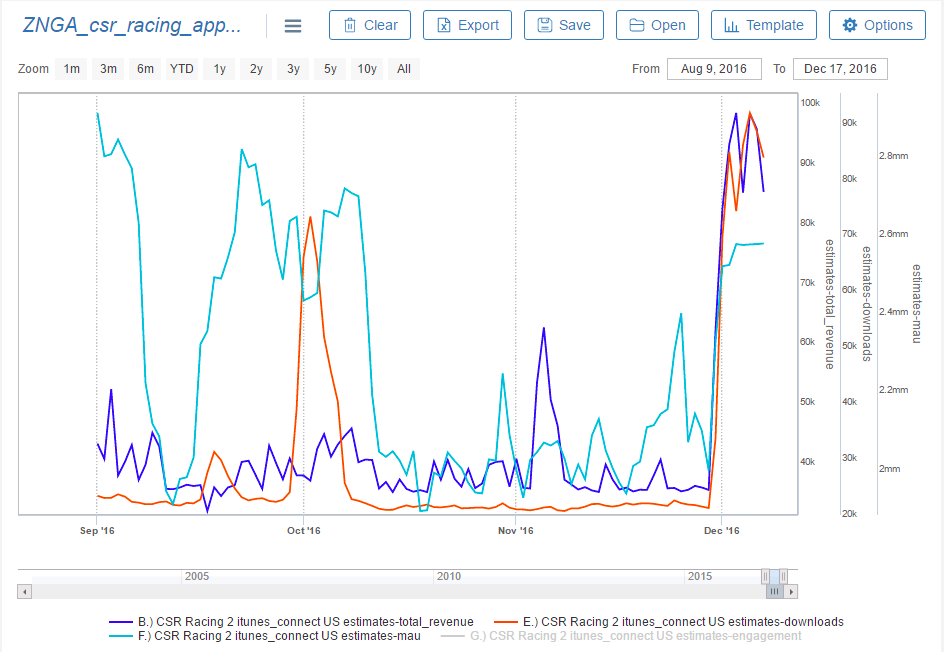
3. ARPU is already as high as $15, and all in iOS
The solid engagement seen above is no accident. One highly unusual move that Zynga took was to delay the launch of its game this time last year:
“given how strong the early monetization is for the game, we believe that a move of 200 basis points in day 30 retention has the potential to make the game a breakout hit.”
So the monetization is leading the retention drive and not the other way round. Zynga are likely seeing better exit rates than we do, but the story is consistent that strong monetization lead to them aggressively finetuning the game to increase retention. They know only too well that you only get to enjoy the post launch bump once.
After looking through Apptopia’s data, the reason is more evident.
DoT iOS Revenue Breakdown
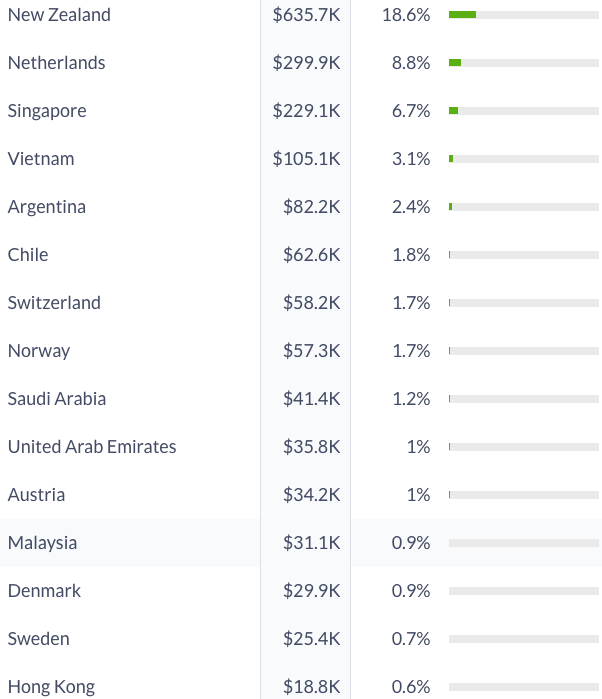
source: Apptopia
DoT Android Revenue Breakdown

source: Apptopia
No surprise that iOS users pay more than Android, but the size of the revenue differences are startling. iOS revenues are more than an order of magnitude higher than Android, reflecting the critical role superior graphics and hardware is playing in DoT’s monetization. The other noteworthy element is that the game has already made seven figures in estimated bookings and in particular New Zealanders are so nuts about paying up for the game that ARPU is as high as $15 (taking monthly revenue over active user numbers) although that is sure to be an outlier.
What About the US?
That is the five hundred million dollar question. We will work with Apptopia to gather data as the US rollout gets underway, and follow up with that in part 2 of this post. Subscribe to keep posted. Meanwhile, we welcome all feedback on these thoughts. Sentieo Mosaic subscribers can request access to Apptopia data in their charts starting today.